Market Indicators
Stock Market
The S&P 500's impressive 18.19% rally in 2023 pales compared to NASDAQ's tech-driven 36% surge. The Information Technology Index, the clear leader, underscores the continuing supremacy of tech stocks.
5 Yr
10 Yr
Max

1 Yr
10 Yr
Max

Commodity Prices
In 2023, gold prices rose by 6.34%, even setting a new record in June at $2,055. Crude oil prices bounced back to $75.63 a barrel after dropping to $67. Copper went up by 4.51% this year, but it's still down 20% from its 2022 peak.
1 Yr
5 Yr
10 Yr

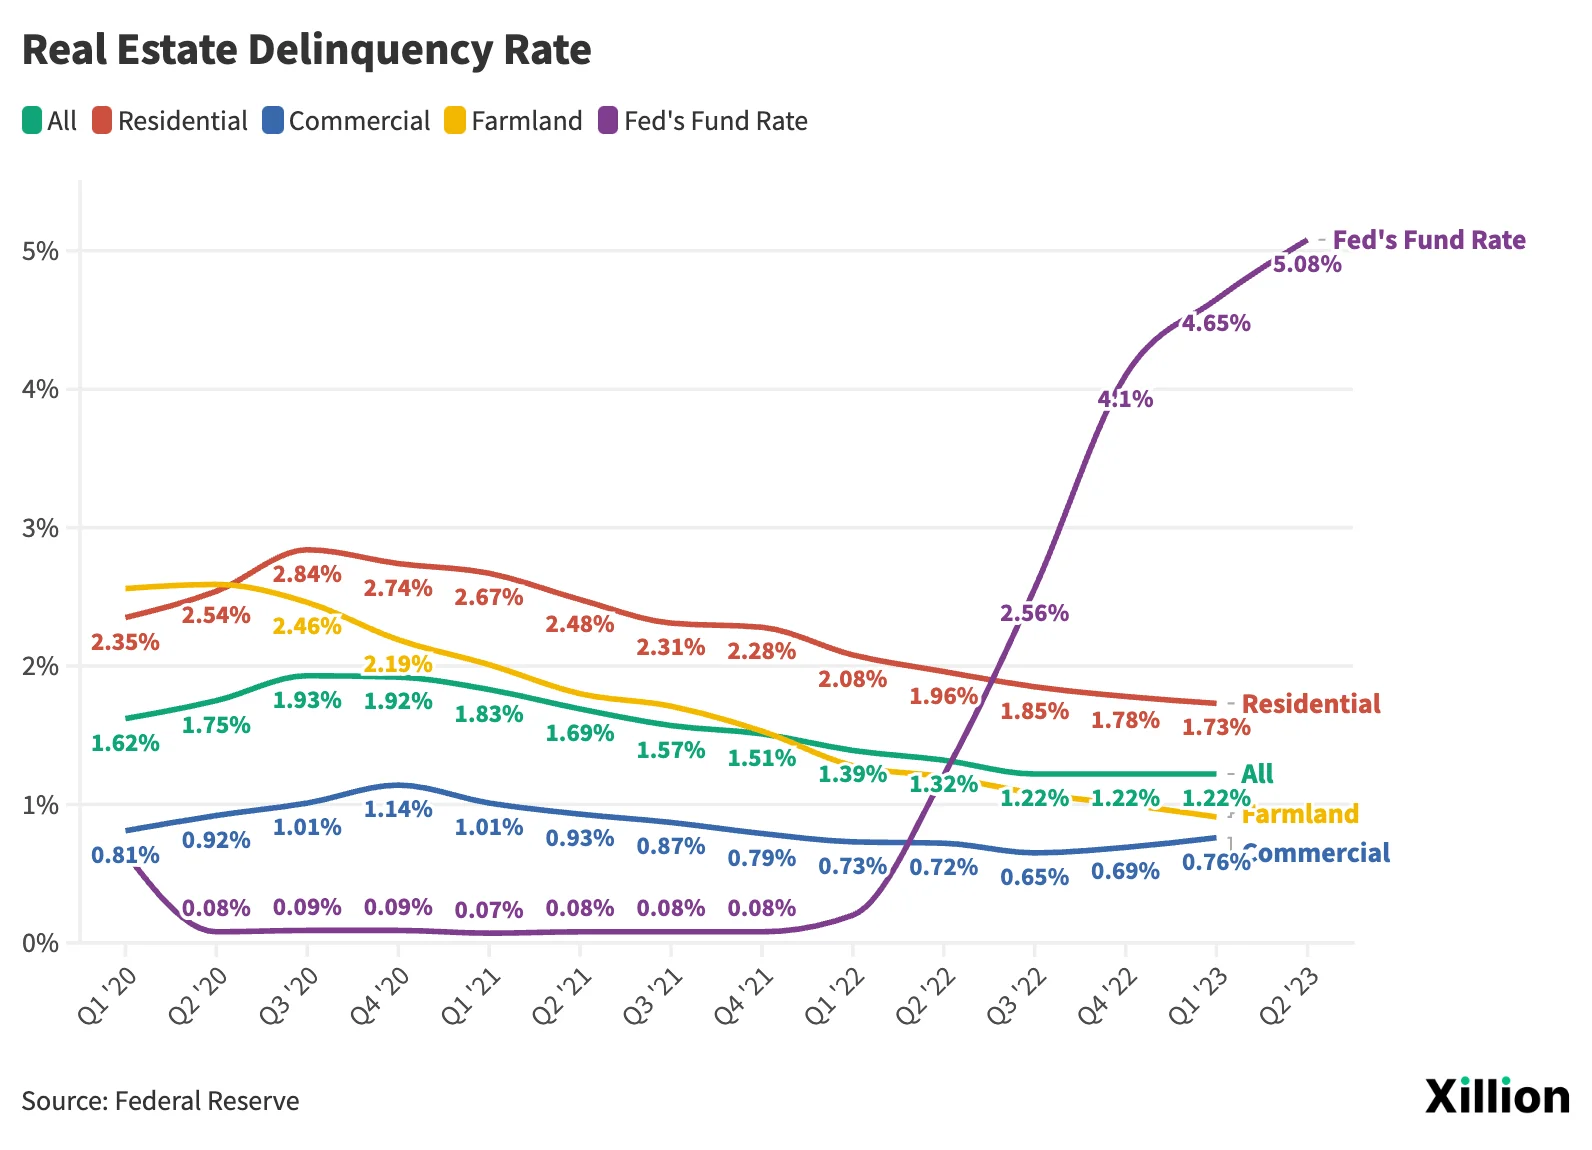
Delinquency Rates
In Q1 2023, consumer loan delinquency rates rose to 2.23%, mainly due to increased credit card delinquencies. In contrast, agricultural loan delinquency rates have dropped to 0.77% from 2.09% in Q3 2020. Delinquency rates for real estate loans have also continued to decrease.
3 Yr
10 Yr
Max

3 Yr
10 Yr
Max
3 Yr
10 Yr
Max

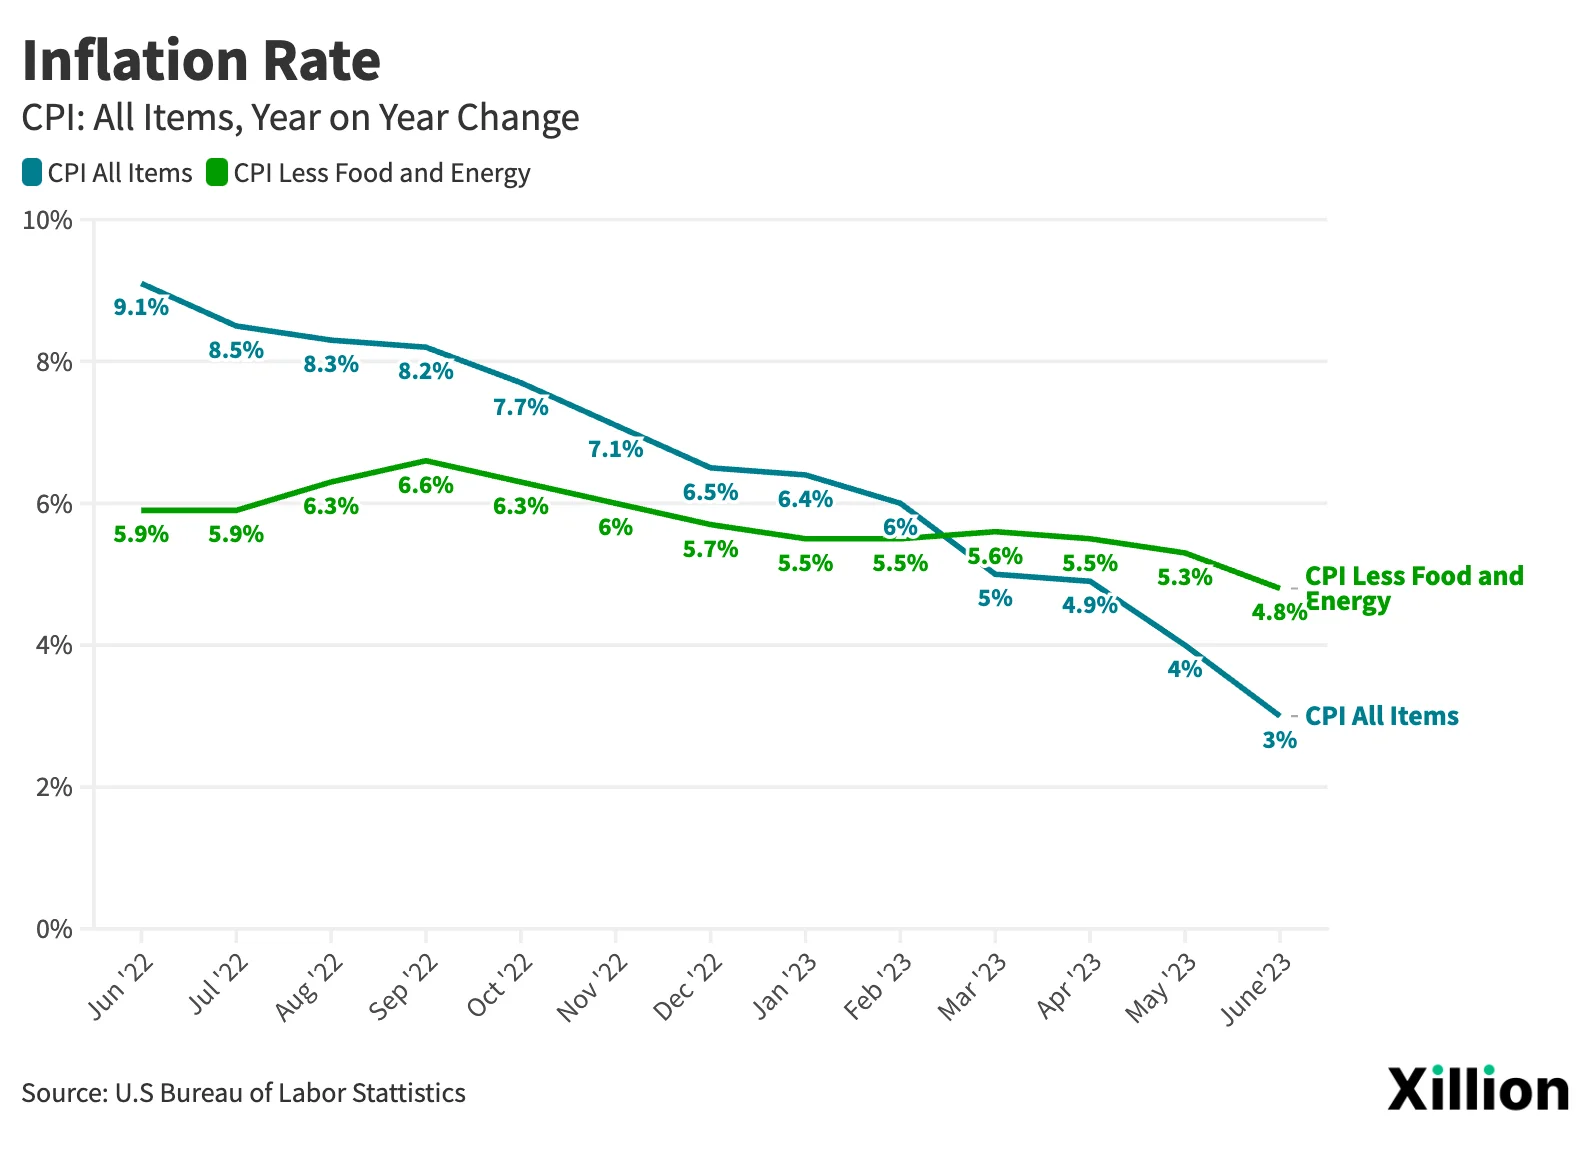
Inflation
Inflation has cooled off, falling to 3% in June 2023 from a high of 9.1% a year earlier. The Consumer Price Index (CPI), excluding food and energy, also saw a decrease to 4.8% in June 2023, down from 5.3% in the previous month.
1 Yr
10 Yr
Max
3 Yr
10 Yr
Max

Real Estate
Despite a significant rise in interest rates over the past year, homeownership rates have continued to climb. However, the rental vacancy rate also rose to 6.4% from a 2022 low of 5.6%. Both new residential construction and new home sales are beginning to bounce back after a sharp drop.
3 Yr
10 Yr
Max

3 Yr
10 Yr
30 Yr

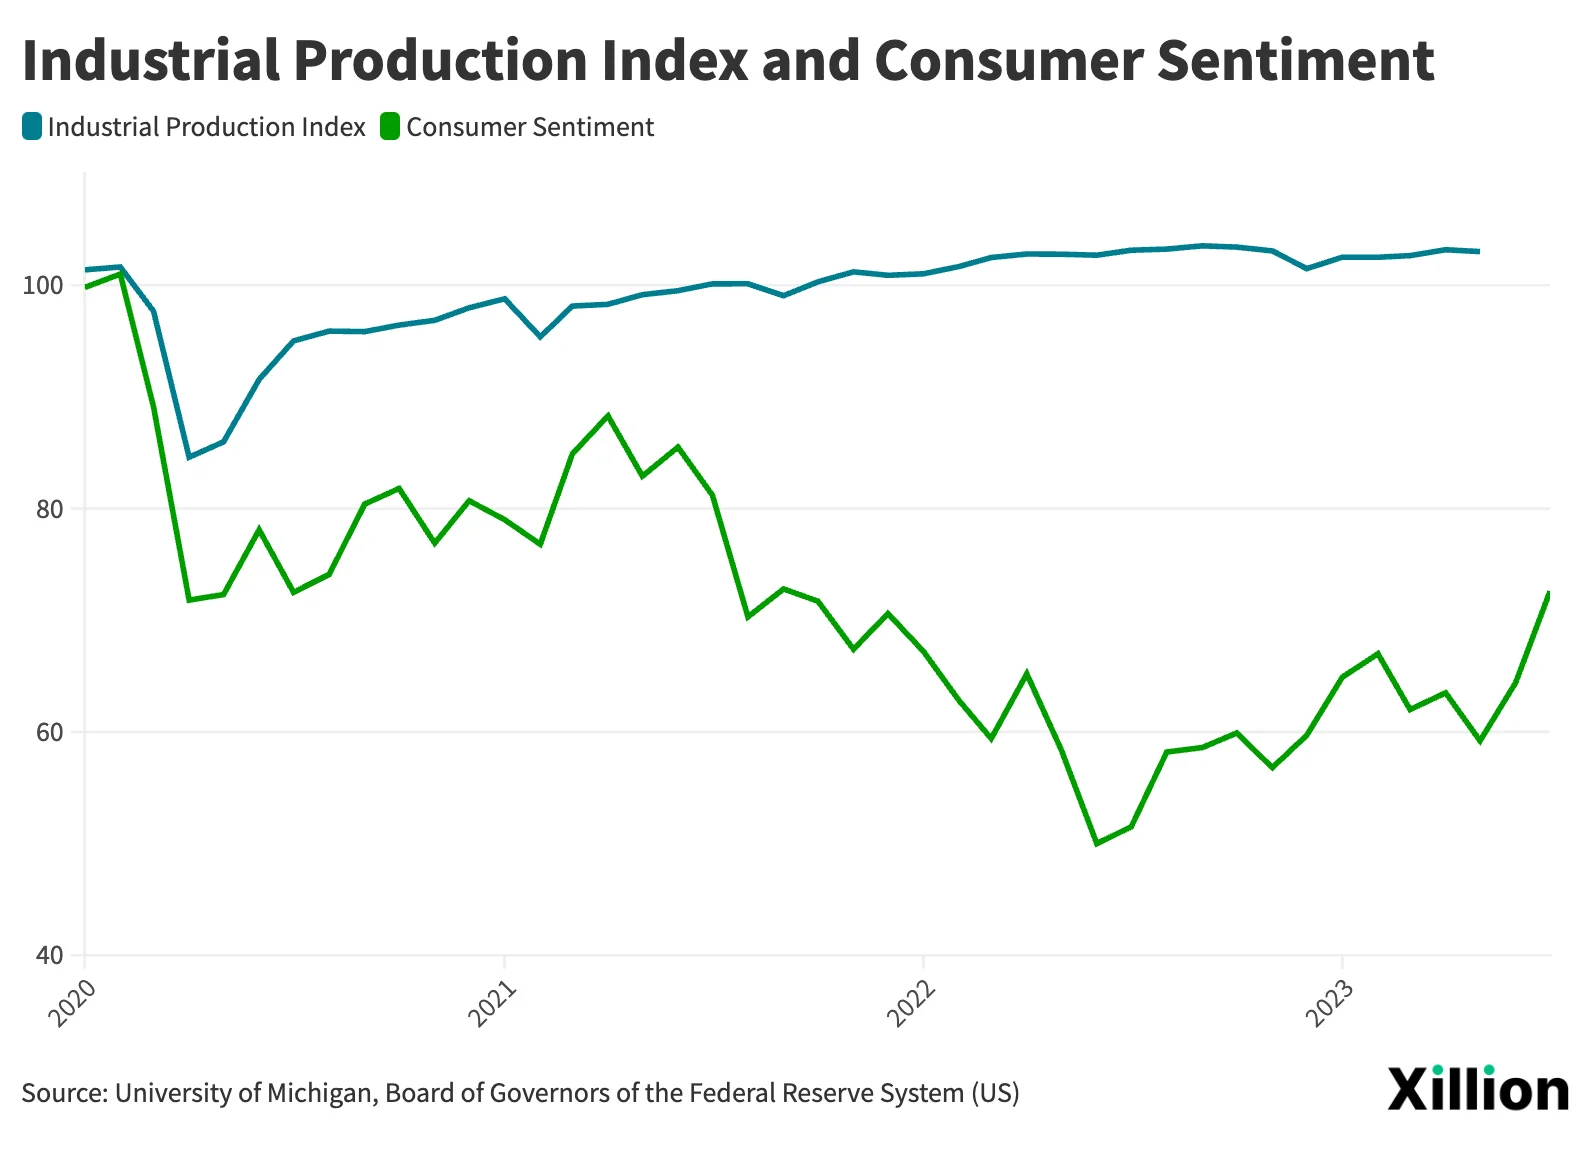
Sentiment
Consumer Sentiment rebounded to 72.6 from the low of 50 in June 2022 , the Industrial Production Index also remained robust. Monthly motor vehicle sales are near their all-time highs. While orders for construction materials are seeing a slight decrease, demand for consumer durable goods is rising. Even though job openings have dropped, unemployment levels are near record lows, indicating a mixed job market.
3 Yr
10 Yr
30 Yr
3 Yr
10 Yr
Max

3 Yr
10 Yr
Max

3 Yr
10 Yr
Max

Personal Finances
The Personal Savings Rate has held steady, floating between 3.5% and 5.0%, and landed at 4.6% in May. In contrast, Real Disposable Income growth has been volatile. Meanwhile, thanks to easing inflation, we're seeing a continual decline in Consumption Expenditure growth.
3 Yr
10 Yr
Max
